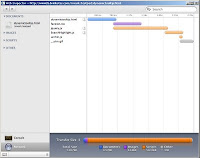
The latest versions of new browsers contain powerful Web Development tools that are a boon to web developers. IE 8 has Developer Tools (keyboard shortcut F12), Safari 3 on Windows has a feature called Web Inspector & related Developer utilities accessible from the Develop option in the Menu and in Opera 9.6, Developer Tools (also called
Dragonfly) is available from the Tools menu under Advanced option. Firefox 3 however contains just a Error Console that outputs validation errors and warnings exhibited by CSS and JavaScript connected to a loaded web page and the Firebug extension which offers more elaborate features for the web developer has to be installed explicitly. These tools offer great insight about how well performing the web pages that we have built are.
I like the Network Timeline option (part of Web Inspector) in Safari 3 that not only shows a HTTP Waterfall chart but also the sizes of various elements (images, scripts etc) of a web page that we want to inspect.
(click on image to magnify)


